How to setup and access QuestDB using Python

What is QuestDB?
It is a tremendously fast NewSQL database which is avaiable as Open source software under Apache 2.0 license. It is basically like a superset of a SQL database (with added features and support for time-varying data or event data). It is made with the prime focus on performance.
What makes QuestDB stand apart from other databases?
- SIMD aggregations: QuestDB uses vectorized operations to perform many operations on only one CPU procedure which makes it do tasks in a must faster and efficient way.
- Easily switch to embedded
- Cloud native
- Cheaper development costs
- Lesser hardware requirements
- Can generate Real time insights
- Easy and secure Enterprise integration
- Postgres wire and Rest API support
Install QuestDB using Docker
Step 1: Installing Docker
Follow the instructions here and choose the docker installer based on your Operating system: https://docs.docker.com/engine/install/
Step 2: Pulling the QuestDB image and creating a docker container
docker run -p 9000:9000 -p 8812:8812 questdb/questdbThis parameter will publish a port to the host, you can specify:
-p 9000:9000for the REST API and the Web Console. The web console is available on http://localhost:9000-p 8812:8812for the Postgres wire protocol-p 9009:9009InfluxDB line protocol
Step 3: Checking if the QuestDB container is running or not
Use docker ps to check container status.
Step 4: Python and Jupyter installation
- Check python version with python –version or python3 –version
- If python is available then run
pip3 install requests urlib matplotlib pandasto install requried modules - Install jupyter using
pip3 install --upgrade ipython jupyter - Enter
jupyter notebookwhich will start jupyter, once it is up create a new notebook
Creating a Database in QuestDB
We would generate some random data and store that data into a test database named weather which we would create. The create statement in QuestDB pushes the data into the bottom of the table. Our data is comprised of:
tempis the temperature in Celcius.rain24His the amount of precipitation in the last 24 hours.thunderis a boolean returning True if thunder is present.timestampis the date and time. If the below code block prints 200, it means the database was created successfully. If it prints 400 then it means that the database already exists.
Code:
import requests
import urllib.parse as par

q = 'create table weather'\
    '(temp int,'\
    'rain24H double,'\
    'thunder boolean,'\
    'timestamp timestamp)'\
    'timestamp(timestamp)'
r = requests.get("http://localhost:9000/exec?query=" + q)
print(r.status_code)
Output: 400
Adding data to QuestDB
In the next code cell, we generate and add 1000 entries of data to our database.
import requests
import random
from datetime import datetime
success = 0
fail = 0
random.seed()
for x in range(1000):
    temp = random.randint(-40, 55)
    rain24H = round(random.uniform(10.45, 235.15), 2)
    thunder = bool(random.getrandbits(1))
    query = "insert into weather values("\
        + str(temp) + ","\
        + str(rain24H) + "," \
        + str(thunder) +",systimestamp())"
    r = requests.get("http://localhost:9000/exec?query=" + query)
    if r.status_code == 200:
        success += 1
    else:
        fail += 1

print("Rows inserted: " + str(success))
if fail > 0:
    print("Rows Failed: " + str(fail))
Output: Rows inserted: 1000
Query data from QuestDB
import requests
import io

r = requests.get("http://localhost:9000/exp?query=select * from weather")
rawData = r.text
print(rawData)
Output:
"tempF","rain24H","thunder","timestamp"
-37,234.0,false,"2020-08-24T11:41:37.191530Z"
-11,165.52,false,"2020-08-24T11:41:37.195714Z"
-31,178.13,true,"2020-08-24T11:41:37.202453Z"
14,31.470000000000,true,"2020-08-24T11:41:37.208365Z"
33,83.31,true,"2020-08-24T11:41:37.214347Z"
Convert raw output to DataFrame
import pandas as pd

pData = pd.read_csv(io.StringIO(rawData), parse_dates=['timestamp'])
print(pData)
Output:
      tempF  rain24H  thunder                        timestamp
0       -37   234.00    False 2020-08-24 11:41:37.191530+00:00
1       -11   165.52    False 2020-08-24 11:41:37.195714+00:00
2       -31   178.13     True 2020-08-24 11:41:37.202453+00:00
3        14    31.47     True 2020-08-24 11:41:37.208365+00:00
4        33    83.31     True 2020-08-24 11:41:37.214347+00:00
...     ...      ...      ...                              ...
3995    -24   183.22    False 2020-08-24 11:58:32.164254+00:00
3996      1   151.96     True 2020-08-24 11:58:32.166610+00:00
3997    -40   213.86     True 2020-08-24 11:58:32.170839+00:00
3998    -33   101.91     True 2020-08-24 11:58:32.173131+00:00
3999    -38   182.98    False 2020-08-24 11:58:32.177191+00:00

[4000 rows x 4 columns]
Note: The query string must be URL-encoded before it is sent.
import urllib.parse

q = "select tempF,"\
    " rain24H,"\
    " timestamp"\
    " from weather"\

query = urllib.parse.quote(q)
r = requests.get("http://localhost:9000/exp?query=" + query)
queryData = r.content
rawData = pd.read_csv(io.StringIO(queryData.decode('utf-8')))
print(rawData)
Output:
      tempF  rain24H                    timestamp
0       -37   234.00  2020-08-24T11:41:37.191530Z
1       -11   165.52  2020-08-24T11:41:37.195714Z
2       -31   178.13  2020-08-24T11:41:37.202453Z
3        14    31.47  2020-08-24T11:41:37.208365Z
4        33    83.31  2020-08-24T11:41:37.214347Z
...     ...      ...                          ...
3995    -24   183.22  2020-08-24T11:58:32.164254Z
3996      1   151.96  2020-08-24T11:58:32.166610Z
3997    -40   213.86  2020-08-24T11:58:32.170839Z
3998    -33   101.91  2020-08-24T11:58:32.173131Z
3999    -38   182.98  2020-08-24T11:58:32.177191Z

[4000 rows x 3 columns]
Plotting data using matplotlib
from matplotlib import pyplot as plt

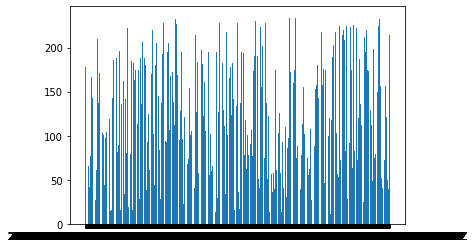
plt.bar(rawData['timestamp'], rawData['rain24H'])
from matplotlib import pyplot as plt

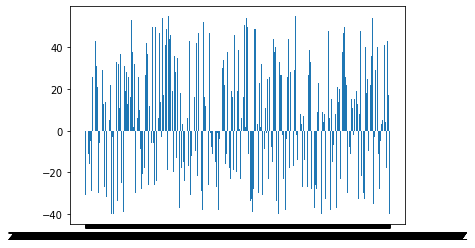
plt.bar(rawData['timestamp'], rawData['tempF'])
Download notebook
Check out the complete notebook at questdb.ipynb
Help us improve this content by editing this page on GitHub