Calculating Variance in R
In this section we’ll look at how to calculate Variance in R.
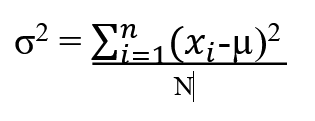
Variance is defined as the sum of squares of deviations of the set of numbers from the mean value. It is a measure of how far a set of data are dispersed out from their mean value . It is always a non -negative number. It is generally denoted by sigma squared σ2 (sigma squared)

Where
x= Data set valuesµ= Mean valueN= Total number of observations
Let’s have a look at an example that we considered for calculation of mean 3, 5, 7, 9, 11, 13, 15.
The mean value in this case is (3 + 5 + 7 + 9 + 11 + 13 + 15 ) / 7 = 9
- Squares of the deviations from the mean value µ is calculated as
(3-9)^2 = 36, (5-9)^2 = 16, (7-9)^2 = 4, (9-9)^2 = 0, (11-9)^2 = 4, (13-9)^2 = 16, (15-9)^2 = 36 - Sum all the squares of deviation and divide it by the number of observations
(36 + 16 + 4 + 0 + 4 + 16 + 36 ) / 7 = 16. Hence the variance in this example is16.
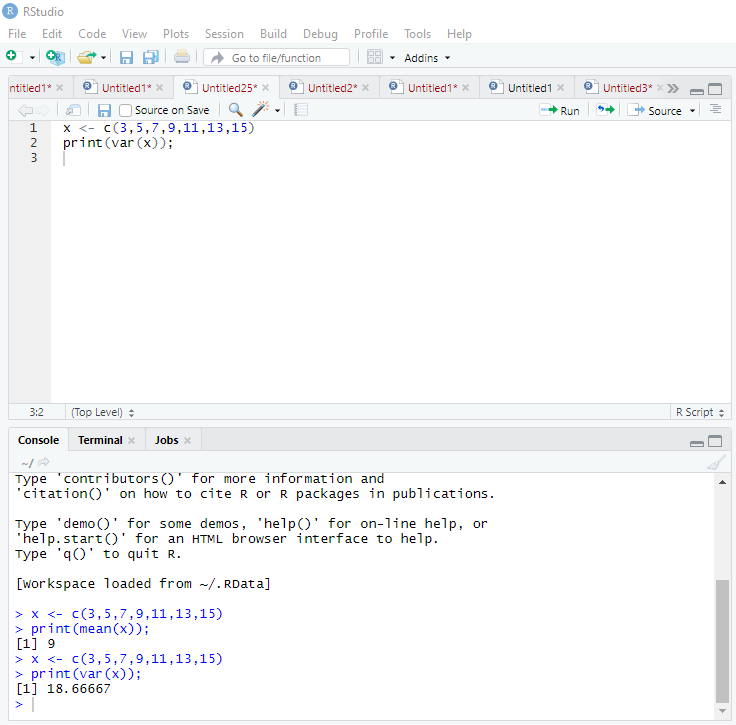
R provides an in-built function var() to compute the variance of all data values in the dataset with respect to the mean. The function takes numeric or integer vector as an argument and returns the result.

xis a variable that takes the integer vectors usingc()function- The result of
var(x)is displayed usingprint
In the next section we’ll look at Standard Deviation
Help us improve this content by editing this page on GitHub