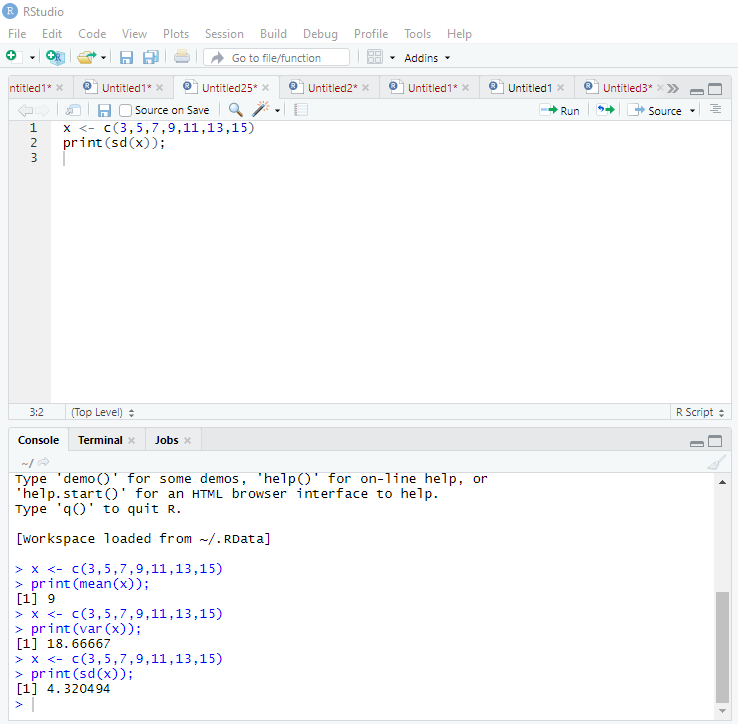
Calculating Standard Deviation in R
In this section we’ll look at how to calculate Standard Deviation in R.
It is a measure of spread of statistical data from its mean or average value. It determines how the data is deviated from its central value. In mathematical terms, it is simply defined as the square root of the variance and is denoted by σ.

- The smallest value of the standard deviation is zero since it cannot be negative.
- When the data values are very close to each other, then standard deviation is considered to be very low or zero. Similarly when the data values are apart, the standard deviation is high or far from zero.
Let’s take the same example that we used in last section to calculate variance
- Dataset =
3, 5, 7, 9, 11, 13, 15. - Mean =
(3 + 5 + 7 + 9 + 11 + 13 + 15 ) / 7 = 9 - Squares of deviation =
(3-9)^2 = 36, (5-9)^2 = 16, (7-9)^2 = 4, (9-9)^2 = 0, (11-9)^2 = 4, (13-9)^2 = 16, (15-9)^2 = 36 - Variance =
(36 + 16 + 4 + 0 + 4 + 16 + 36 ) / 7 = 16 - Standard Deviation = σ = square root of 16 = 4
R provides an in-built function sd() to compute the standard deviation of all the data in the dataset from the central point. The function takes numeric or integer vector as an argument and returns the standard deviation value.

xis a variable that takes the integer vectors usingc()function- The result of
sd(x)is displayed usingprint
Help us improve this content by editing this page on GitHub