Calculating Average (Mean, Median, Mode) in R
Statistics is a branch of mathematics that deals with numerical data analysis. Statistics is the study of the collection, analysis, organization, interpretation and presentation of data.
R language has been an excellent tool for statistical computation of data which includes statistical modeling, data oriented strategies and use of probability distribution and randomization in analysis. R provides various tools and functions to perform the statistical analysis of data with ease.
In this article we’ll look at various measures of central tendencies like mean, median, mode and deviation of various sample values from the central point in the distribution.
Average
An average is defined as the number in statistics that measures the central tendency of a given a set of numbers. The various types of averages that will be used in statistical computations are
- Mean
- Mode
- Median
Let’s have a look at each of these measures of central tendency one by one.
Mean
Mean is defined as the sum of all the observations divided by total number of sample observations. The basic formula for the mean of all the observations y1, y2, y3,…yn is given by
X = y1+ y2 + y3 + ... + yn / n
Let us consider an example of dataset containing 7 datapoints 3, 5, 7, 9, 11, 13, 15
The Mean in this case would be X = (3 + 5 + 7 + 9 + 11 + 13 + 15 ) / 7 = 9
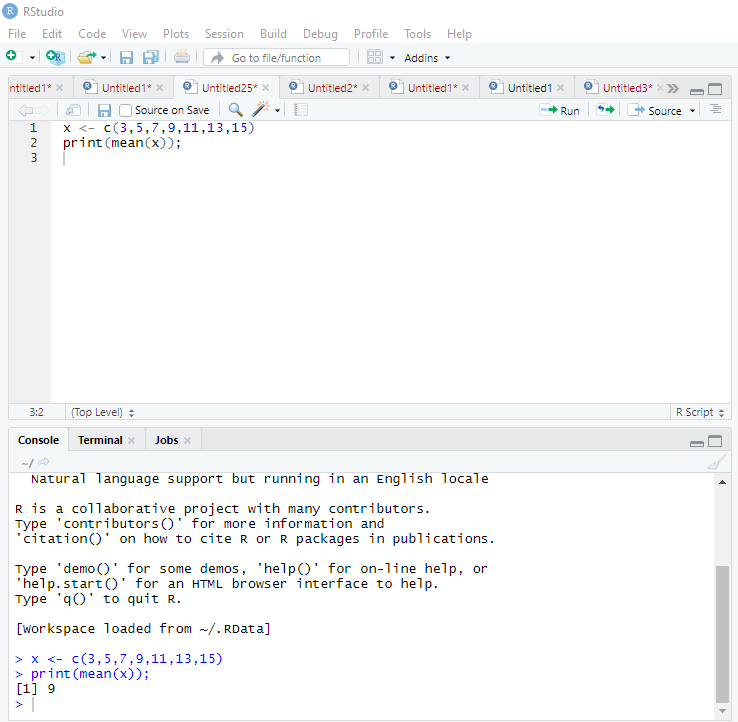
R provides an in-built function mean() to compute the mean of all values in the dataset. The function takes numeric or integer vector as an argument and returns the result.

xis a variable that takes the integer vectors usingc()function- The result of
mean(x)is displayed usingprint
Syntax of mean()
mean(x, na.rm)
Here, x is the numeric/integer vector and na.rm is a Boolean value to remove NA (undefined values) from the given dataset.
Mode
Mode is defined as a number in a set of numbers that occurs the most (maximum frequency) in the given dataset.
Let us consider an example of dataset containing 12 datapoints 2, 4, 6, 4, 9, 5, 4, 2, 4, 4, 2, 6
In the above example, 4 has the maximum frequency among the set of numbers. Hence, 4 is the mode of this dataset.
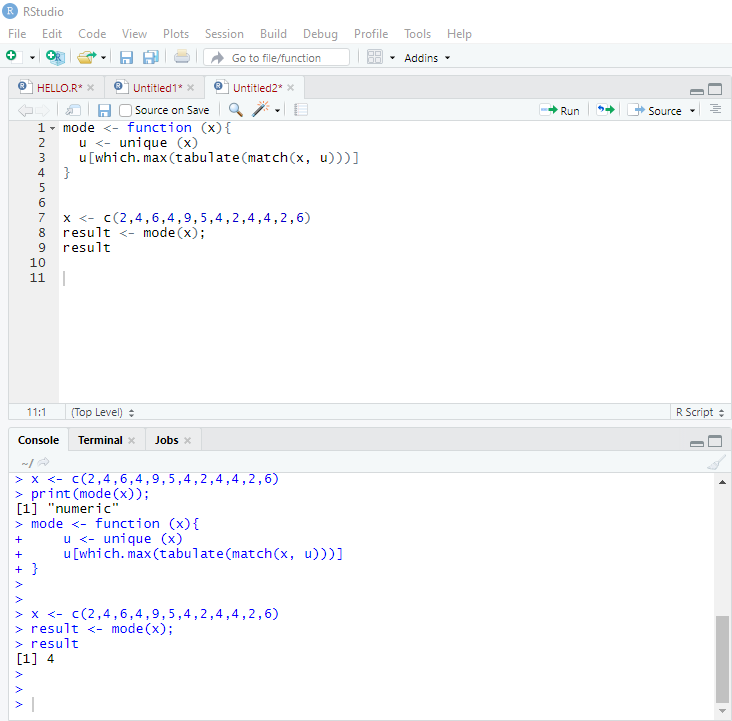
R does not have an in-built function to compute the mode for a given set of numbers. So, a user defined function is created.
mode(x)is a user defined function here.- The body of the function contains call to
unique(x)function to filter out all the duplicate elements and in the next stepwhich.max(tabulate(match(x,u)))is contained in the body to determine the mode of the given dataset. mode(x)function is then invoked and return value is stored in the variableresult

Median
Median is defined as the middle value among the set of numbers when all the numbers are sorted.
- If the total numbers in dataset are odd, the median will lie at
(n+1)/2location. - If the total numbers in dataset are even, the medians will lie at
(n/2)and(n/2)+1locations.
Let us consider an example of dataset containing 9 datapoints 3, 12, 4, 8, 15, 1, 23, 11, 7
- Arrange the numbers in ascending order such that the above example looks like
1, 3, 4, 7, 8, 11, 12, 15, 23. - Find the middle value, that will be at
(9+1)/2i.e. at 5th position. Hence, 8 is our median.
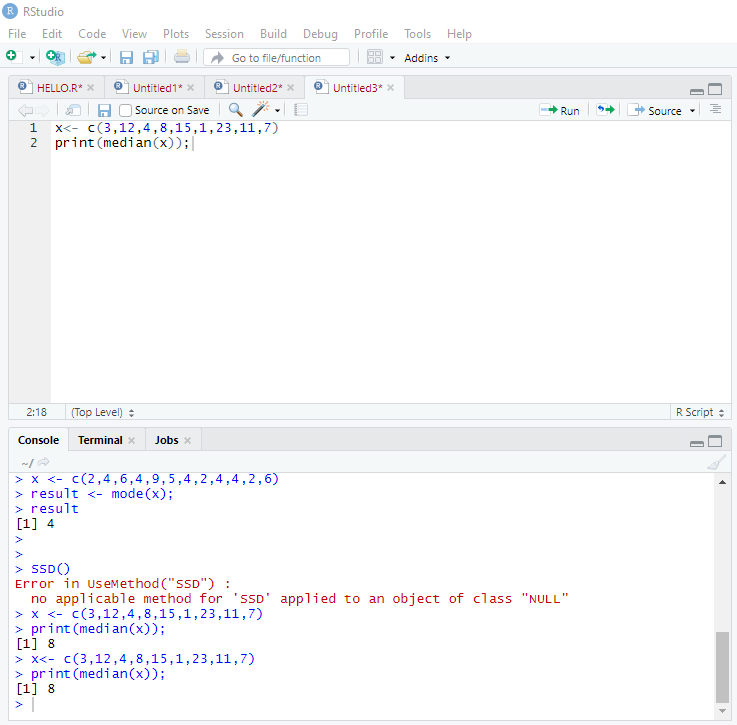
R provides an in-built function median() to compute the median or middle value of all values in the dataset. The function takes numeric or integer vector as an argument and returns the median value.

xis a variable that takes the integer vectors usingc()function- The result of
median(x)is displayed usingprint
In the next section we’ll look at Variance
Help us improve this content by editing this page on GitHub