Chapter 5 - Web scraping with Pandas
%matplotlib inline
import pandas as pd
import matplotlib.pyplot as plt
import numpy as np

pd.set_option('display.mpl_style', 'default')
plt.rcParams['figure.figsize'] = (15, 3)
plt.rcParams['font.family'] = 'sans-serif'
Summary
By the end of this chapter, we’re going to have downloaded all of Canada’s weather data for 2012, and saved it to a CSV.
We’ll do this by downloading it one month at a time, and then combining all the months together.
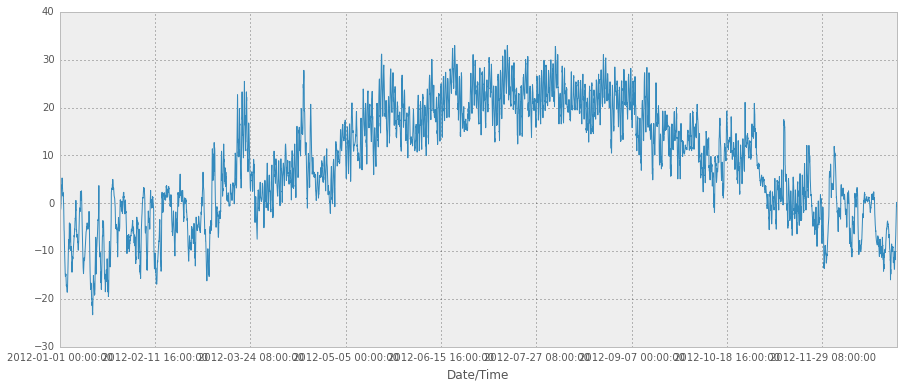
Here’s the temperature every hour for 2012! Download weather_2012.csv and try yourself.
weather_2012_final = pd.read_csv('weather_2012.csv', index_col='Date/Time')
weather_2012_final['Temp (C)'].plot(figsize=(15, 6))
Output:
5.1 Downloading one month of weather data
When playing with the cycling data, I wanted temperature and precipitation data to find out if people like biking when it’s raining. So I went to the site for Canadian historical weather data, and figured out how to get it automatically.
Here we’re going to get the data for March 2012, and clean it up
Here’s an URL template you can use to get data in Montreal.
url_template = "http://climate.weather.gc.ca/climate_data/bulk_data_e.html?format=csv&stationID=5415&Year={year}&Month={month}&timeframe=1&submit=Download+Data"
To get the data for March 2013, we need to format it with month=3, year=2012.
url = url_template.format(month=3, year=2012)
weather_mar2012 = pd.read_csv(url, index_col='Date/Time', parse_dates=True)
This is super great! We can just use the same read_csv function as before, and just give it a URL as a filename. Awesome.
There are 16 rows of metadata at the top of this CSV, but pandas knows CSVs are weird, so there’s a skiprows options. We parse the dates again, and set ‘Date/Time’ to be the index column. Here’s the resulting dataframe.
Output:
| Year | Month | Day | Time | Data Quality | Temp (°C) | Temp Flag | Dew Point Temp (°C) | Dew Point Temp Flag | Rel Hum (%) | ... | Wind Spd Flag | Visibility (km) | Visibility Flag | Stn Press (kPa) | Stn Press Flag | Hmdx | Hmdx Flag | Wind Chill | Wind Chill Flag | Weather |
|---|
| Date/Time | | | | | | | | | | | | | | | | | | | | | |
|---|
| 2012-03-01 00:00:00 | 2012 | 3 | 1 | 00:00 | | -5.5 | NaN | -9.7 | NaN | 72 | ... | NaN | 4.0 | NaN | 100.97 | NaN | NaN | NaN | -13 | NaN | Snow |
|---|
| 2012-03-01 01:00:00 | 2012 | 3 | 1 | 01:00 | | -5.7 | NaN | -8.7 | NaN | 79 | ... | NaN | 2.4 | NaN | 100.87 | NaN | NaN | NaN | -13 | NaN | Snow |
|---|
| 2012-03-01 02:00:00 | 2012 | 3 | 1 | 02:00 | | -5.4 | NaN | -8.3 | NaN | 80 | ... | NaN | 4.8 | NaN | 100.80 | NaN | NaN | NaN | -13 | NaN | Snow |
|---|
| 2012-03-01 03:00:00 | 2012 | 3 | 1 | 03:00 | | -4.7 | NaN | -7.7 | NaN | 79 | ... | NaN | 4.0 | NaN | 100.69 | NaN | NaN | NaN | -12 | NaN | Snow |
|---|
| 2012-03-01 04:00:00 | 2012 | 3 | 1 | 04:00 | | -5.4 | NaN | -7.8 | NaN | 83 | ... | NaN | 1.6 | NaN | 100.62 | NaN | NaN | NaN | -14 | NaN | Snow |
|---|
| 2012-03-01 05:00:00 | 2012 | 3 | 1 | 05:00 | | -5.3 | NaN | -7.9 | NaN | 82 | ... | NaN | 2.4 | NaN | 100.58 | NaN | NaN | NaN | -14 | NaN | Snow |
|---|
| 2012-03-01 06:00:00 | 2012 | 3 | 1 | 06:00 | | -5.2 | NaN | -7.8 | NaN | 82 | ... | NaN | 4.0 | NaN | 100.57 | NaN | NaN | NaN | -14 | NaN | Snow |
|---|
| 2012-03-01 07:00:00 | 2012 | 3 | 1 | 07:00 | | -4.9 | NaN | -7.4 | NaN | 83 | ... | NaN | 1.6 | NaN | 100.59 | NaN | NaN | NaN | -13 | NaN | Snow |
|---|
| 2012-03-01 08:00:00 | 2012 | 3 | 1 | 08:00 | | -5.0 | NaN | -7.5 | NaN | 83 | ... | NaN | 1.2 | NaN | 100.59 | NaN | NaN | NaN | -13 | NaN | Snow |
|---|
| 2012-03-01 09:00:00 | 2012 | 3 | 1 | 09:00 | | -4.9 | NaN | -7.5 | NaN | 82 | ... | NaN | 1.6 | NaN | 100.60 | NaN | NaN | NaN | -13 | NaN | Snow |
|---|
| 2012-03-01 10:00:00 | 2012 | 3 | 1 | 10:00 | | -4.7 | NaN | -7.3 | NaN | 82 | ... | NaN | 1.2 | NaN | 100.62 | NaN | NaN | NaN | -13 | NaN | Snow |
|---|
| 2012-03-01 11:00:00 | 2012 | 3 | 1 | 11:00 | | -4.4 | NaN | -6.8 | NaN | 83 | ... | NaN | 1.0 | NaN | 100.66 | NaN | NaN | NaN | -12 | NaN | Snow |
|---|
| 2012-03-01 12:00:00 | 2012 | 3 | 1 | 12:00 | | -4.3 | NaN | -6.8 | NaN | 83 | ... | NaN | 1.2 | NaN | 100.66 | NaN | NaN | NaN | -12 | NaN | Snow |
|---|
| 2012-03-01 13:00:00 | 2012 | 3 | 1 | 13:00 | | -4.3 | NaN | -6.9 | NaN | 82 | ... | NaN | 1.2 | NaN | 100.65 | NaN | NaN | NaN | -12 | NaN | Snow |
|---|
| 2012-03-01 14:00:00 | 2012 | 3 | 1 | 14:00 | | -3.9 | NaN | -6.6 | NaN | 81 | ... | NaN | 1.2 | NaN | 100.67 | NaN | NaN | NaN | -11 | NaN | Snow |
|---|
| 2012-03-01 15:00:00 | 2012 | 3 | 1 | 15:00 | | -3.3 | NaN | -6.2 | NaN | 80 | ... | NaN | 1.6 | NaN | 100.71 | NaN | NaN | NaN | -10 | NaN | Snow |
|---|
| 2012-03-01 16:00:00 | 2012 | 3 | 1 | 16:00 | | -2.7 | NaN | -5.7 | NaN | 80 | ... | NaN | 2.4 | NaN | 100.74 | NaN | NaN | NaN | -8 | NaN | Snow |
|---|
| 2012-03-01 17:00:00 | 2012 | 3 | 1 | 17:00 | | -2.9 | NaN | -5.9 | NaN | 80 | ... | NaN | 4.0 | NaN | 100.80 | NaN | NaN | NaN | -9 | NaN | Snow |
|---|
| 2012-03-01 18:00:00 | 2012 | 3 | 1 | 18:00 | | -3.0 | NaN | -6.0 | NaN | 80 | ... | NaN | 4.0 | NaN | 100.87 | NaN | NaN | NaN | -9 | NaN | Snow |
|---|
| 2012-03-01 19:00:00 | 2012 | 3 | 1 | 19:00 | | -3.6 | NaN | -6.4 | NaN | 81 | ... | NaN | 3.2 | NaN | 100.93 | NaN | NaN | NaN | -9 | NaN | Snow |
|---|
| 2012-03-01 20:00:00 | 2012 | 3 | 1 | 20:00 | | -3.7 | NaN | -6.4 | NaN | 81 | ... | NaN | 4.8 | NaN | 100.95 | NaN | NaN | NaN | -10 | NaN | Snow |
|---|
| 2012-03-01 21:00:00 | 2012 | 3 | 1 | 21:00 | | -3.9 | NaN | -6.7 | NaN | 81 | ... | NaN | 6.4 | NaN | 100.98 | NaN | NaN | NaN | -10 | NaN | Snow |
|---|
| 2012-03-01 22:00:00 | 2012 | 3 | 1 | 22:00 | | -4.3 | NaN | -6.9 | NaN | 82 | ... | NaN | 2.4 | NaN | 101.00 | NaN | NaN | NaN | -11 | NaN | Snow |
|---|
| 2012-03-01 23:00:00 | 2012 | 3 | 1 | 23:00 | | -4.3 | NaN | -7.1 | NaN | 81 | ... | NaN | 4.8 | NaN | 101.04 | NaN | NaN | NaN | -11 | NaN | Snow |
|---|
| 2012-03-02 00:00:00 | 2012 | 3 | 2 | 00:00 | | -4.8 | NaN | -7.3 | NaN | 83 | ... | NaN | 3.2 | NaN | 101.04 | NaN | NaN | NaN | -12 | NaN | Snow |
|---|
| 2012-03-02 01:00:00 | 2012 | 3 | 2 | 01:00 | | -5.3 | NaN | -7.9 | NaN | 82 | ... | NaN | 4.8 | NaN | 101.09 | NaN | NaN | NaN | -12 | NaN | Snow |
|---|
| 2012-03-02 02:00:00 | 2012 | 3 | 2 | 02:00 | | -5.2 | NaN | -7.8 | NaN | 82 | ... | NaN | 6.4 | NaN | 101.11 | NaN | NaN | NaN | -12 | NaN | Snow |
|---|
| 2012-03-02 03:00:00 | 2012 | 3 | 2 | 03:00 | | -5.5 | NaN | -7.9 | NaN | 83 | ... | NaN | 4.8 | NaN | 101.15 | NaN | NaN | NaN | -12 | NaN | Snow |
|---|
| 2012-03-02 04:00:00 | 2012 | 3 | 2 | 04:00 | | -5.6 | NaN | -8.2 | NaN | 82 | ... | NaN | 6.4 | NaN | 101.15 | NaN | NaN | NaN | -13 | NaN | Snow |
|---|
| 2012-03-02 05:00:00 | 2012 | 3 | 2 | 05:00 | | -5.5 | NaN | -8.3 | NaN | 81 | ... | NaN | 12.9 | NaN | 101.15 | NaN | NaN | NaN | -12 | NaN | Snow |
|---|
| ... | ... | ... | ... | ... | ... | ... | ... | ... | ... | ... | ... | ... | ... | ... | ... | ... | ... | ... | ... | ... | ... |
|---|
| 2012-03-30 18:00:00 | 2012 | 3 | 30 | 18:00 | | 3.9 | NaN | -7.9 | NaN | 42 | ... | NaN | 24.1 | NaN | 101.26 | NaN | NaN | NaN | NaN | NaN | Mostly Cloudy |
|---|
| 2012-03-30 19:00:00 | 2012 | 3 | 30 | 19:00 | | 3.1 | NaN | -6.7 | NaN | 49 | ... | NaN | 25.0 | NaN | 101.29 | NaN | NaN | NaN | NaN | NaN | Mostly Cloudy |
|---|
| 2012-03-30 20:00:00 | 2012 | 3 | 30 | 20:00 | | 3.0 | NaN | -8.4 | NaN | 43 | ... | NaN | 25.0 | NaN | 101.30 | NaN | NaN | NaN | NaN | NaN | Mostly Cloudy |
|---|
| 2012-03-30 21:00:00 | 2012 | 3 | 30 | 21:00 | | 1.7 | NaN | -9.0 | NaN | 45 | ... | NaN | 25.0 | NaN | 101.32 | NaN | NaN | NaN | NaN | NaN | Cloudy |
|---|
| 2012-03-30 22:00:00 | 2012 | 3 | 30 | 22:00 | | 0.4 | NaN | -8.1 | NaN | 53 | ... | NaN | 25.0 | NaN | 101.30 | NaN | NaN | NaN | NaN | NaN | Mostly Cloudy |
|---|
| 2012-03-30 23:00:00 | 2012 | 3 | 30 | 23:00 | | 1.4 | NaN | -7.7 | NaN | 51 | ... | NaN | 25.0 | NaN | 101.34 | NaN | NaN | NaN | NaN | NaN | Mainly Clear |
|---|
| 2012-03-31 00:00:00 | 2012 | 3 | 31 | 00:00 | | 1.5 | NaN | -8.6 | NaN | 47 | ... | NaN | 25.0 | NaN | 101.33 | NaN | NaN | NaN | NaN | NaN | Mostly Cloudy |
|---|
| 2012-03-31 01:00:00 | 2012 | 3 | 31 | 01:00 | | 1.3 | NaN | -9.6 | NaN | 44 | ... | NaN | 25.0 | NaN | 101.31 | NaN | NaN | NaN | NaN | NaN | Mostly Cloudy |
|---|
| 2012-03-31 02:00:00 | 2012 | 3 | 31 | 02:00 | | 1.3 | NaN | -9.7 | NaN | 44 | ... | NaN | 25.0 | NaN | 101.29 | NaN | NaN | NaN | NaN | NaN | Cloudy |
|---|
| 2012-03-31 03:00:00 | 2012 | 3 | 31 | 03:00 | | 0.7 | NaN | -8.8 | NaN | 49 | ... | NaN | 25.0 | NaN | 101.30 | NaN | NaN | NaN | NaN | NaN | Cloudy |
|---|
| 2012-03-31 04:00:00 | 2012 | 3 | 31 | 04:00 | | -0.9 | NaN | -8.5 | NaN | 56 | ... | NaN | 25.0 | NaN | 101.32 | NaN | NaN | NaN | -5 | NaN | Cloudy |
|---|
| 2012-03-31 05:00:00 | 2012 | 3 | 31 | 05:00 | | -0.6 | NaN | -9.2 | NaN | 52 | ... | NaN | 25.0 | NaN | 101.30 | NaN | NaN | NaN | -5 | NaN | Cloudy |
|---|
| 2012-03-31 06:00:00 | 2012 | 3 | 31 | 06:00 | | -0.5 | NaN | -9.2 | NaN | 52 | ... | NaN | 48.3 | NaN | 101.32 | NaN | NaN | NaN | -5 | NaN | Cloudy |
|---|
| 2012-03-31 07:00:00 | 2012 | 3 | 31 | 07:00 | | -0.3 | NaN | -9.2 | NaN | 51 | ... | NaN | 48.3 | NaN | 101.32 | NaN | NaN | NaN | -5 | NaN | Cloudy |
|---|
| 2012-03-31 08:00:00 | 2012 | 3 | 31 | 08:00 | | 0.7 | NaN | -8.5 | NaN | 50 | ... | NaN | 48.3 | NaN | 101.33 | NaN | NaN | NaN | NaN | NaN | Cloudy |
|---|
| 2012-03-31 09:00:00 | 2012 | 3 | 31 | 09:00 | | 1.5 | NaN | -7.8 | NaN | 50 | ... | NaN | 48.3 | NaN | 101.34 | NaN | NaN | NaN | NaN | NaN | Mostly Cloudy |
|---|
| 2012-03-31 10:00:00 | 2012 | 3 | 31 | 10:00 | | 2.9 | NaN | -8.1 | NaN | 44 | ... | NaN | 48.3 | NaN | 101.30 | NaN | NaN | NaN | NaN | NaN | Mainly Clear |
|---|
| 2012-03-31 11:00:00 | 2012 | 3 | 31 | 11:00 | | 4.6 | NaN | -9.7 | NaN | 35 | ... | NaN | 48.3 | NaN | 101.24 | NaN | NaN | NaN | NaN | NaN | Clear |
|---|
| 2012-03-31 12:00:00 | 2012 | 3 | 31 | 12:00 | | 6.4 | NaN | -7.1 | NaN | 37 | ... | NaN | 48.3 | NaN | 101.16 | NaN | NaN | NaN | NaN | NaN | Clear |
|---|
| 2012-03-31 13:00:00 | 2012 | 3 | 31 | 13:00 | | 6.5 | NaN | -9.7 | NaN | 30 | ... | NaN | 48.3 | NaN | 101.08 | NaN | NaN | NaN | NaN | NaN | Clear |
|---|
| 2012-03-31 14:00:00 | 2012 | 3 | 31 | 14:00 | | 7.7 | NaN | -8.5 | NaN | 31 | ... | NaN | 48.3 | NaN | 101.01 | NaN | NaN | NaN | NaN | NaN | Mainly Clear |
|---|
| 2012-03-31 15:00:00 | 2012 | 3 | 31 | 15:00 | | 7.7 | NaN | -8.6 | NaN | 30 | ... | NaN | 48.3 | NaN | 100.94 | NaN | NaN | NaN | NaN | NaN | Mainly Clear |
|---|
| 2012-03-31 16:00:00 | 2012 | 3 | 31 | 16:00 | | 8.4 | NaN | -7.7 | NaN | 31 | ... | NaN | 48.3 | NaN | 100.89 | NaN | NaN | NaN | NaN | NaN | Mainly Clear |
|---|
| 2012-03-31 17:00:00 | 2012 | 3 | 31 | 17:00 | | 7.9 | NaN | -8.1 | NaN | 31 | ... | NaN | 48.3 | NaN | 100.88 | NaN | NaN | NaN | NaN | NaN | Mainly Clear |
|---|
| 2012-03-31 18:00:00 | 2012 | 3 | 31 | 18:00 | | 7.0 | NaN | -8.2 | NaN | 33 | ... | NaN | 48.3 | NaN | 100.87 | NaN | NaN | NaN | NaN | NaN | Mainly Clear |
|---|
| 2012-03-31 19:00:00 | 2012 | 3 | 31 | 19:00 | | 5.9 | NaN | -8.0 | NaN | 36 | ... | NaN | 25.0 | NaN | 100.88 | NaN | NaN | NaN | NaN | NaN | Clear |
|---|
| 2012-03-31 20:00:00 | 2012 | 3 | 31 | 20:00 | | 4.4 | NaN | -7.2 | NaN | 43 | ... | NaN | 25.0 | NaN | 100.85 | NaN | NaN | NaN | NaN | NaN | Clear |
|---|
| 2012-03-31 21:00:00 | 2012 | 3 | 31 | 21:00 | | 2.6 | NaN | -6.3 | NaN | 52 | ... | NaN | 25.0 | NaN | 100.86 | NaN | NaN | NaN | NaN | NaN | Clear |
|---|
| 2012-03-31 22:00:00 | 2012 | 3 | 31 | 22:00 | | 2.7 | NaN | -6.7 | NaN | 50 | ... | NaN | 25.0 | NaN | 100.82 | NaN | NaN | NaN | NaN | NaN | Clear |
|---|
| 2012-03-31 23:00:00 | 2012 | 3 | 31 | 23:00 | | 1.5 | NaN | -6.9 | NaN | 54 | ... | NaN | 25.0 | NaN | 100.79 | NaN | NaN | NaN | NaN | NaN | Clear |
|---|
744 rows × 24 columns
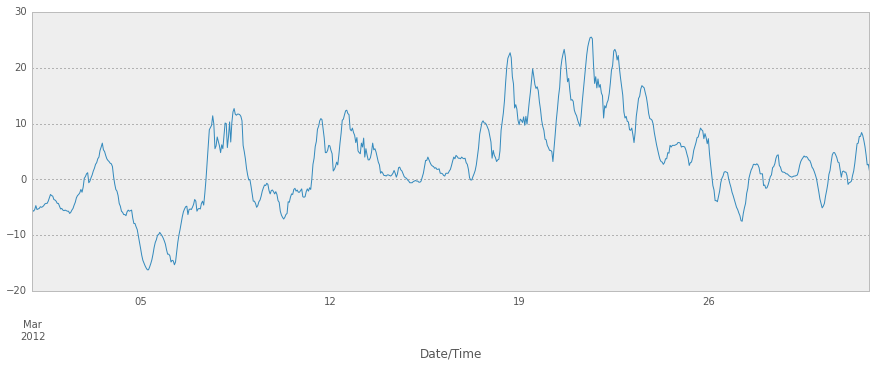
Let’s plot it!
weather_mar2012[u"Temp (\xc2\xb0C)"].plot(figsize=(15, 5))
Output:
Notice how it goes up to 25° C in the middle there? That was a big deal. It was March, and people were wearing shorts outside.
And I was out of town and I missed it. Still sad, humans.
I had to write ‘\xb0’ for that degree character °. Let’s fix up the columns. We’re going to just print them out, copy, and fix them up by hand.
weather_mar2012.columns = [
    u'Year', u'Month', u'Day', u'Time', u'Data Quality', u'Temp (C)',
    u'Temp Flag', u'Dew Point Temp (C)', u'Dew Point Temp Flag',
    u'Rel Hum (%)', u'Rel Hum Flag', u'Wind Dir (10s deg)', u'Wind Dir Flag',
    u'Wind Spd (km/h)', u'Wind Spd Flag', u'Visibility (km)', u'Visibility Flag',
    u'Stn Press (kPa)', u'Stn Press Flag', u'Hmdx', u'Hmdx Flag', u'Wind Chill',
    u'Wind Chill Flag', u'Weather']
You’ll notice in the summary above that there are a few columns which are are either entirely empty or only have a few values in them. Let’s get rid of all of those with dropna.
The argument axis=1 to dropna means “drop columns”, not rows”, and how='any' means “drop the column if any value is null”.
This is much better now – we only have columns with real data.
weather_mar2012 = weather_mar2012.dropna(axis=1, how='any')
weather_mar2012[:5]
Output:
| Year | Month | Day | Time | Data Quality | Temp (C) | Dew Point Temp (C) | Rel Hum (%) | Wind Spd (km/h) | Visibility (km) | Stn Press (kPa) | Weather |
|---|
| Date/Time | | | | | | | | | | | | |
|---|
| 2012-03-01 00:00:00 | 2012 | 3 | 1 | 00:00 | | -5.5 | -9.7 | 72 | 24 | 4.0 | 100.97 | Snow |
|---|
| 2012-03-01 01:00:00 | 2012 | 3 | 1 | 01:00 | | -5.7 | -8.7 | 79 | 26 | 2.4 | 100.87 | Snow |
|---|
| 2012-03-01 02:00:00 | 2012 | 3 | 1 | 02:00 | | -5.4 | -8.3 | 80 | 28 | 4.8 | 100.80 | Snow |
|---|
| 2012-03-01 03:00:00 | 2012 | 3 | 1 | 03:00 | | -4.7 | -7.7 | 79 | 28 | 4.0 | 100.69 | Snow |
|---|
| 2012-03-01 04:00:00 | 2012 | 3 | 1 | 04:00 | | -5.4 | -7.8 | 83 | 35 | 1.6 | 100.62 | Snow |
|---|
The Year/Month/Day/Time columns are redundant, though, and the Data Quality column doesn’t look too useful. Let’s get rid of those.
The axis=1 argument means “Drop columns”, like before. The default for operations like dropna and drop is always to operate on rows.
weather_mar2012 = weather_mar2012.drop(['Year', 'Month', 'Day', 'Time', 'Data Quality'], axis=1)
weather_mar2012[:5]
Output:
| Temp (C) | Dew Point Temp (C) | Rel Hum (%) | Wind Spd (km/h) | Visibility (km) | Stn Press (kPa) | Weather |
|---|
| Date/Time | | | | | | | |
|---|
| 2012-03-01 00:00:00 | -5.5 | -9.7 | 72 | 24 | 4.0 | 100.97 | Snow |
|---|
| 2012-03-01 01:00:00 | -5.7 | -8.7 | 79 | 26 | 2.4 | 100.87 | Snow |
|---|
| 2012-03-01 02:00:00 | -5.4 | -8.3 | 80 | 28 | 4.8 | 100.80 | Snow |
|---|
| 2012-03-01 03:00:00 | -4.7 | -7.7 | 79 | 28 | 4.0 | 100.69 | Snow |
|---|
| 2012-03-01 04:00:00 | -5.4 | -7.8 | 83 | 35 | 1.6 | 100.62 | Snow |
|---|
Awesome! We now only have the relevant columns, and it’s much more manageable.
5.2 Plotting the temperature by hour of day
This one’s just for fun – we’ve already done this before, using groupby and aggregate! We will learn whether or not it gets colder at night. Well, obviously. But let’s do it anyway.
temperatures = weather_mar2012[[u'Temp (C)']].copy()
print(temperatures.head)
temperatures.loc[:,'Hour'] = weather_mar2012.index.hour
temperatures.groupby('Hour').aggregate(np.median).plot()
Output:
Date/Time
2012-03-01 00:00:00      -5.5
2012-03-01 01:00:00      -5.7
2012-03-01 02:00:00      -5.4
2012-03-01 03:00:00      -4.7
2012-03-01 04:00:00      -5.4
2012-03-01 05:00:00      -5.3
2012-03-01 06:00:00      -5.2
2012-03-01 07:00:00      -4.9
2012-03-01 08:00:00      -5.0
2012-03-01 09:00:00      -4.9
2012-03-01 10:00:00      -4.7
2012-03-01 11:00:00      -4.4
2012-03-01 12:00:00      -4.3
2012-03-01 13:00:00      -4.3
2012-03-01 14:00:00      -3.9
2012-03-01 15:00:00      -3.3
2012-03-01 16:00:00      -2.7
2012-03-01 17:00:00      -2.9
2012-03-01 18:00:00      -3.0
2012-03-01 19:00:00      -3.6
2012-03-01 20:00:00      -3.7
2012-03-01 21:00:00      -3.9
2012-03-01 22:00:00      -4.3
2012-03-01 23:00:00      -4.3
2012-03-02 00:00:00      -4.8
2012-03-02 01:00:00      -5.3
2012-03-02 02:00:00      -5.2
2012-03-02 03:00:00      -5.5
2012-03-02 04:00:00      -5.6
2012-03-02 05:00:00      -5.5
...                       ...
2012-03-30 18:00:00       3.9
2012-03-30 19:00:00       3.1
2012-03-30 20:00:00       3.0
2012-03-30 21:00:00       1.7
2012-03-30 22:00:00       0.4
2012-03-30 23:00:00       1.4
2012-03-31 00:00:00       1.5
2012-03-31 01:00:00       1.3
2012-03-31 02:00:00       1.3
2012-03-31 03:00:00       0.7
2012-03-31 04:00:00      -0.9
2012-03-31 05:00:00      -0.6
2012-03-31 06:00:00      -0.5
2012-03-31 07:00:00      -0.3
2012-03-31 08:00:00       0.7
2012-03-31 09:00:00       1.5
2012-03-31 10:00:00       2.9
2012-03-31 11:00:00       4.6
2012-03-31 12:00:00       6.4
2012-03-31 13:00:00       6.5
2012-03-31 14:00:00       7.7
2012-03-31 15:00:00       7.7
2012-03-31 16:00:00       8.4
2012-03-31 17:00:00       7.9
2012-03-31 18:00:00       7.0
2012-03-31 19:00:00       5.9
2012-03-31 20:00:00       4.4
2012-03-31 21:00:00       2.6
2012-03-31 22:00:00       2.7
2012-03-31 23:00:00       1.5

[744 rows x 1 columns]>
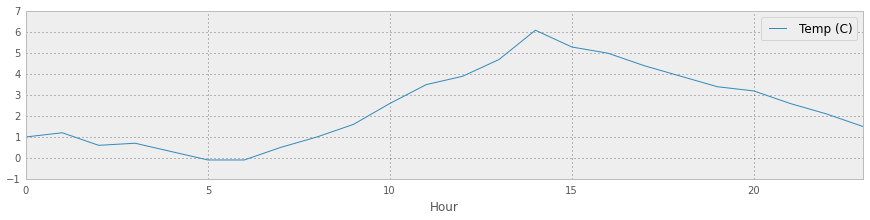
So it looks like the time with the highest median temperature is 2pm. Neat.
5.3 Getting the whole year of data
Okay, so what if we want the data for the whole year? Ideally the API would just let us download that, but I couldn’t figure out a way to do that.
First, let’s put our work from above into a function that gets the weather for a given month.
I noticed that there’s an irritating bug where when I ask for January, it gives me data for the previous year, so we’ll fix that too. [no, really. You can check =)]
def download_weather_month(year, month):
    if month == 1:
        year += 1
    url = url_template.format(year=year, month=month)
    weather_data = pd.read_csv(url, skiprows=15, index_col='Date/Time', parse_dates=True, header=True)
    weather_data = weather_data.dropna(axis=1)
    weather_data.columns = [col.replace('\xb0', '') for col in weather_data.columns]
    weather_data = weather_data.drop(['Year', 'Day', 'Month', 'Time', 'Data Quality'], axis=1)
    return weather_data
We can test that this function does the right thing:
download_weather_month(2012, 1)[:5]
Output:
| Temp (C) | Dew Point Temp (C) | Rel Hum (%) | Wind Spd (km/h) | Visibility (km) | Stn Press (kPa) | Weather |
|---|
| Date/Time | | | | | | | |
|---|
| 2013-01-01 00:00:00 | -1.0 | -1.7 | 95 | 35 | 6.4 | 99.89 | Snow |
|---|
| 2013-01-01 01:00:00 | -2.0 | -5.1 | 79 | 35 | 16.1 | 99.93 | Mainly Clear |
|---|
| 2013-01-01 02:00:00 | -2.7 | -6.0 | 78 | 28 | 19.3 | 100.08 | Snow |
|---|
| 2013-01-01 03:00:00 | -5.6 | -11.7 | 62 | 30 | 25.0 | 100.21 | Clear |
|---|
| 2013-01-01 04:00:00 | -7.7 | -12.6 | 68 | 35 | 19.3 | 100.32 | Mainly Clear |
|---|
Now we can get all the months at once. This will take a little while to run.
data_by_month = [download_weather_month(2012, i) for i in range(1, 13)]
Once we have this, it’s easy to concatenate all the dataframes together into one big dataframe using pd.concat. And now we have the whole year’s data!
weather_2012 = pd.concat(data_by_month)
weather_2012
Output:
| Temp (C) | Dew Point Temp (C) | Rel Hum (%) | Wind Spd (km/h) | Visibility (km) | Stn Press (kPa) | Weather |
|---|
| Date/Time | | | | | | | |
|---|
| 2013-01-01 00:00:00 | -1.0 | -1.7 | 95 | 35 | 6.4 | 99.89 | Snow |
|---|
| 2013-01-01 01:00:00 | -2.0 | -5.1 | 79 | 35 | 16.1 | 99.93 | Mainly Clear |
|---|
| 2013-01-01 02:00:00 | -2.7 | -6.0 | 78 | 28 | 19.3 | 100.08 | Snow |
|---|
| 2013-01-01 03:00:00 | -5.6 | -11.7 | 62 | 30 | 25.0 | 100.21 | Clear |
|---|
| 2013-01-01 04:00:00 | -7.7 | -12.6 | 68 | 35 | 19.3 | 100.32 | Mainly Clear |
|---|
| 2013-01-01 05:00:00 | -9.7 | -14.8 | 66 | 33 | 25.0 | 100.47 | Clear |
|---|
| 2013-01-01 06:00:00 | -11.1 | -17.0 | 62 | 30 | 25.0 | 100.65 | Clear |
|---|
| 2013-01-01 07:00:00 | -12.2 | -17.2 | 66 | 20 | 25.0 | 100.78 | Clear |
|---|
| 2013-01-01 08:00:00 | -13.0 | -17.7 | 68 | 13 | 24.1 | 100.87 | Clear |
|---|
| 2013-01-01 09:00:00 | -13.0 | -17.3 | 70 | 20 | 24.1 | 100.86 | Clear |
|---|
| 2013-01-01 10:00:00 | -12.6 | -17.8 | 65 | 19 | 24.1 | 100.90 | Clear |
|---|
| 2013-01-01 11:00:00 | -12.2 | -17.6 | 64 | 22 | 24.1 | 100.88 | Mainly Clear |
|---|
| 2013-01-01 12:00:00 | -11.8 | -17.2 | 64 | 26 | 24.1 | 100.87 | Mainly Clear |
|---|
| 2013-01-01 13:00:00 | -11.3 | -17.4 | 61 | 26 | 24.1 | 100.83 | Mainly Clear |
|---|
| 2013-01-01 14:00:00 | -11.3 | -17.4 | 61 | 28 | 24.1 | 100.82 | Mainly Clear |
|---|
| 2013-01-01 15:00:00 | -11.4 | -17.6 | 60 | 30 | 24.1 | 100.85 | Mainly Clear |
|---|
| 2013-01-01 16:00:00 | -12.0 | -18.0 | 61 | 22 | 24.1 | 100.81 | Mainly Clear |
|---|
| 2013-01-01 17:00:00 | -13.0 | -18.4 | 64 | 19 | 25.0 | 100.90 | Clear |
|---|
| 2013-01-01 18:00:00 | -13.4 | -18.4 | 66 | 24 | 25.0 | 100.96 | Clear |
|---|
| 2013-01-01 19:00:00 | -14.1 | -18.7 | 68 | 20 | 25.0 | 101.02 | Clear |
|---|
| 2013-01-01 20:00:00 | -14.3 | -19.0 | 67 | 15 | 25.0 | 101.04 | Clear |
|---|
| 2013-01-01 21:00:00 | -14.8 | -19.5 | 67 | 15 | 25.0 | 100.98 | Mainly Clear |
|---|
| 2013-01-01 22:00:00 | -16.3 | -20.2 | 72 | 7 | 25.0 | 100.98 | Mostly Cloudy |
|---|
| 2013-01-01 23:00:00 | -15.4 | -19.8 | 69 | 11 | 25.0 | 100.99 | Cloudy |
|---|
| 2013-01-02 00:00:00 | -14.0 | -18.4 | 69 | 11 | 19.3 | 100.96 | Snow |
|---|
| 2013-01-02 01:00:00 | -14.1 | -18.3 | 70 | 11 | 25.0 | 100.91 | Mostly Cloudy |
|---|
| 2013-01-02 02:00:00 | -14.3 | -18.3 | 72 | 13 | 25.0 | 100.94 | Snow Showers |
|---|
| 2013-01-02 03:00:00 | -14.7 | -18.0 | 76 | 9 | 19.3 | 100.91 | Snow |
|---|
| 2013-01-02 04:00:00 | -14.2 | -17.1 | 79 | 6 | 9.7 | 100.83 | Snow |
|---|
| 2013-01-02 05:00:00 | -14.3 | -17.0 | 80 | 0 | 6.4 | 100.81 | Snow |
|---|
| ... | ... | ... | ... | ... | ... | ... | ... |
|---|
| 2012-12-30 18:00:00 | -12.6 | -16.0 | 76 | 24 | 25.0 | 101.36 | Mainly Clear |
|---|
| 2012-12-30 19:00:00 | -13.4 | -16.5 | 77 | 26 | 25.0 | 101.47 | Mainly Clear |
|---|
| 2012-12-30 20:00:00 | -13.8 | -16.5 | 80 | 24 | 25.0 | 101.52 | Clear |
|---|
| 2012-12-30 21:00:00 | -13.8 | -16.5 | 80 | 20 | 25.0 | 101.50 | Mainly Clear |
|---|
| 2012-12-30 22:00:00 | -13.7 | -16.3 | 81 | 19 | 25.0 | 101.54 | Mainly Clear |
|---|
| 2012-12-30 23:00:00 | -12.1 | -15.1 | 78 | 28 | 25.0 | 101.52 | Mostly Cloudy |
|---|
| 2012-12-31 00:00:00 | -11.1 | -14.4 | 77 | 26 | 25.0 | 101.51 | Cloudy |
|---|
| 2012-12-31 01:00:00 | -10.7 | -14.0 | 77 | 15 | 25.0 | 101.50 | Cloudy |
|---|
| 2012-12-31 02:00:00 | -10.1 | -13.4 | 77 | 9 | 25.0 | 101.45 | Cloudy |
|---|
| 2012-12-31 03:00:00 | -11.8 | -14.4 | 81 | 6 | 25.0 | 101.42 | Mostly Cloudy |
|---|
| 2012-12-31 04:00:00 | -10.5 | -12.8 | 83 | 11 | 25.0 | 101.34 | Cloudy |
|---|
| 2012-12-31 05:00:00 | -10.2 | -12.4 | 84 | 6 | 25.0 | 101.28 | Cloudy |
|---|
| 2012-12-31 06:00:00 | -9.7 | -11.7 | 85 | 4 | 25.0 | 101.23 | Cloudy |
|---|
| 2012-12-31 07:00:00 | -9.3 | -11.3 | 85 | 0 | 19.3 | 101.19 | Snow Showers |
|---|
| 2012-12-31 08:00:00 | -8.6 | -10.3 | 87 | 4 | 3.2 | 101.14 | Snow Showers |
|---|
| 2012-12-31 09:00:00 | -8.1 | -9.6 | 89 | 4 | 2.4 | 101.09 | Snow |
|---|
| 2012-12-31 10:00:00 | -7.4 | -8.9 | 89 | 4 | 6.4 | 101.05 | Snow,Fog |
|---|
| 2012-12-31 11:00:00 | -6.7 | -7.9 | 91 | 9 | 9.7 | 100.93 | Snow |
|---|
| 2012-12-31 12:00:00 | -5.8 | -7.5 | 88 | 4 | 12.9 | 100.78 | Snow |
|---|
| 2012-12-31 13:00:00 | -4.6 | -6.6 | 86 | 4 | 12.9 | 100.63 | Snow |
|---|
| 2012-12-31 14:00:00 | -3.4 | -5.7 | 84 | 6 | 11.3 | 100.57 | Snow |
|---|
| 2012-12-31 15:00:00 | -2.3 | -4.6 | 84 | 9 | 9.7 | 100.47 | Snow |
|---|
| 2012-12-31 16:00:00 | -1.4 | -4.0 | 82 | 13 | 12.9 | 100.40 | Snow |
|---|
| 2012-12-31 17:00:00 | -1.1 | -3.3 | 85 | 19 | 9.7 | 100.30 | Snow |
|---|
| 2012-12-31 18:00:00 | -1.3 | -3.1 | 88 | 17 | 9.7 | 100.19 | Snow |
|---|
| 2012-12-31 19:00:00 | 0.1 | -2.7 | 81 | 30 | 9.7 | 100.13 | Snow |
|---|
| 2012-12-31 20:00:00 | 0.2 | -2.4 | 83 | 24 | 9.7 | 100.03 | Snow |
|---|
| 2012-12-31 21:00:00 | -0.5 | -1.5 | 93 | 28 | 4.8 | 99.95 | Snow |
|---|
| 2012-12-31 22:00:00 | -0.2 | -1.8 | 89 | 28 | 9.7 | 99.91 | Snow |
|---|
| 2012-12-31 23:00:00 | 0.0 | -2.1 | 86 | 30 | 11.3 | 99.89 | Snow |
|---|
8784 rows × 7 columns
5.4 Saving to a CSV
It’s slow and unnecessary to download the data every time, so let’s save our dataframe for later use!
weather_2012.to_csv('weather_2012.csv')
And we’re done!