Chapter 1 - Reading from a CSV
# Render our plots inline
%matplotlib inline

import pandas as pd
import matplotlib.pyplot as plt

pd.set_option('display.mpl_style', 'default') # Make the graphs a bit prettier
plt.rcParams['figure.figsize'] = (15, 5)
1.1 Reading data from a CSV file
You can read data from a CSV file using the read_csv function. By default, it assumes that the fields are comma-separated.
We’re going to be looking some cyclist data from Montréal. Here’s the original page (in French). We’re using the data from 2012. Download the bikes.csv file to try out the below examples.
This dataset is a list of how many people were on 7 different bike paths in Montreal, each day.
import pandas as pd

broken_df = pd.read_csv('bikes.csv')
# Look at the first 3 rows
broken_df[:3]
Output:
| Date;Berri 1;Br�beuf (donn�es non disponibles);C�te-Sainte-Catherine;Maisonneuve 1;Maisonneuve 2;du Parc;Pierre-Dupuy;Rachel1;St-Urbain (donn�es non disponibles) | |
|---|---|
| 0 | 01/01/2012;35;;0;38;51;26;10;16; |
| 1 | 02/01/2012;83;;1;68;153;53;6;43; |
| 2 | 03/01/2012;135;;2;104;248;89;3;58; |
3 rows × 1 columns
You’ll notice that this is totally broken! read_csv has a bunch of options that will let us fix that, though. Here we’ll
- Change the column separator to a
; - Set the encoding to
'_latin1_'(the default is'_utf8_') - Parse the dates in the
'Date'column - Tell it that our dates have the date first instead of the month first
Set the index to be the
'Date'columnfixed_df = pd.read_csv('bikes.csv', sep=';', encoding='latin1', parse_dates=['Date'], dayfirst=True, index_col='Date') fixed_df[:3]
Output:
| Berri 1 | Brébeuf (données non disponibles) | Côte-Sainte-Catherine | Maisonneuve 1 | Maisonneuve 2 | du Parc | Pierre-Dupuy | Rachel1 | St-Urbain (données non disponibles) | |
|---|---|---|---|---|---|---|---|---|---|
| Date | |||||||||
| 2012-01-01 | 35 | NaN | 0 | 38 | 51 | 26 | 10 | 16 | NaN |
| 2012-01-02 | 83 | NaN | 1 | 68 | 153 | 53 | 6 | 43 | NaN |
| 2012-01-03 | 135 | NaN | 2 | 104 | 248 | 89 | 3 | 58 | NaN |
3 rows × 9 columns
1.2 Selecting a column
When you read a CSV, you get a kind of object called a DataFrame, which is made up of rows and columns. You get columns out of a DataFrame the same way you get elements out of a dictionary.
Here’s an example:
fixed_df['Berri 1']Output:
Date
2012-01-01 35
2012-01-02 83
2012-01-03 135
2012-01-04 144
2012-01-05 197
2012-01-06 146
2012-01-07 98
2012-01-08 95
2012-01-09 244
2012-01-10 397
2012-01-11 273
2012-01-12 157
2012-01-13 75
2012-01-14 32
2012-01-15 54
...
2012-10-22 3650
2012-10-23 4177
2012-10-24 3744
2012-10-25 3735
2012-10-26 4290
2012-10-27 1857
2012-10-28 1310
2012-10-29 2919
2012-10-30 2887
2012-10-31 2634
2012-11-01 2405
2012-11-02 1582
2012-11-03 844
2012-11-04 966
2012-11-05 2247
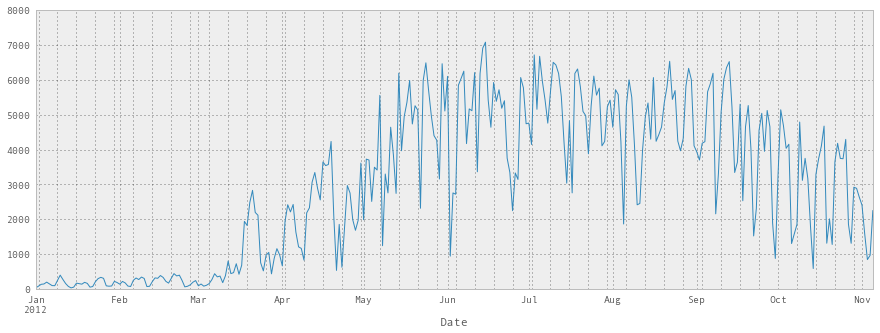
Name: Berri 1, Length: 310, dtype: int641.3 Plotting a column
Just add .plot() to the end! How could it be easier? =)
We can see that, unsurprisingly, not many people are biking in January, February, and March.
import pandas as pd
import matplotlib.pyplot as plt

fixed_df = pd.read_csv('bikes.csv', sep=';', encoding='latin1', parse_dates=['Date'], dayfirst=True, index_col='Date')
fixed_df['Berri 1'].plot()
Output:
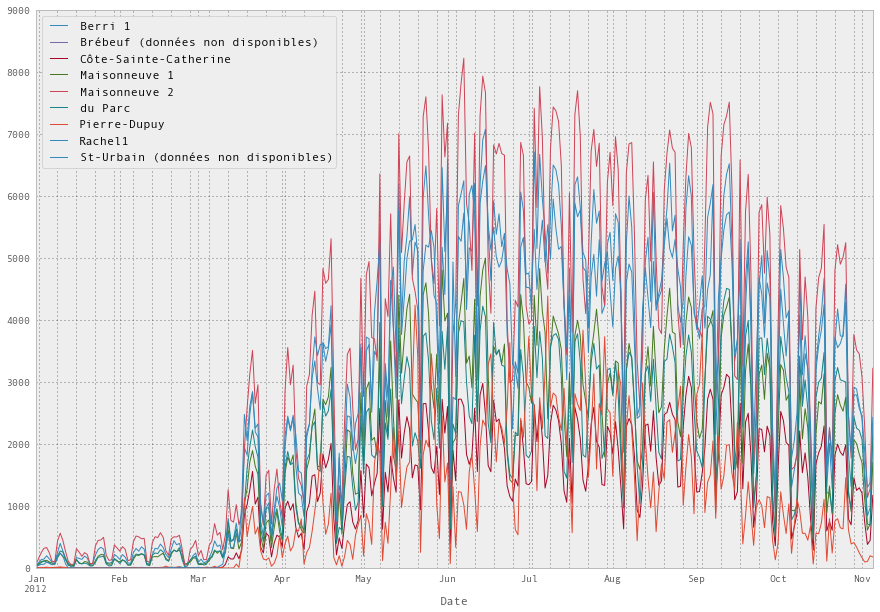
fixed_df.plot(figsize=(15, 10))
plt.show()
Output:
1.4 Putting all that together
Here’s the code we needed to write do draw that graph, all together:
df = pd.read_csv('bikes.csv', sep=';', encoding='latin1', parse_dates=['Date'], dayfirst=True, index_col='Date')
df['Berri 1'].plot()
Output:
Help us improve this content by editing this page on GitHub